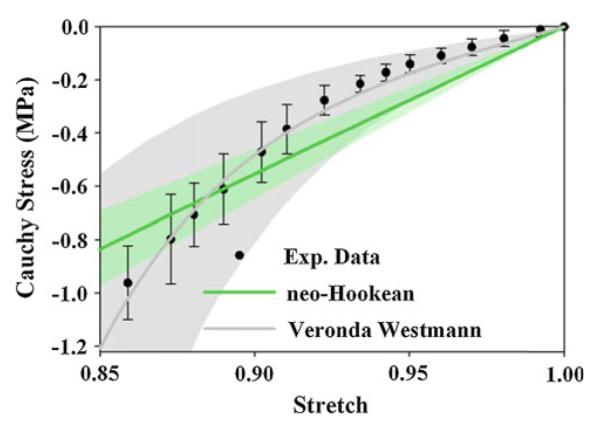
Fig. 7.

Experimental Cauchy stress versus stretch curve for one specimen in the femoral SM region. Error bars standard deviation. Solid lines for each fit represent the response with average coefficients, shaded areas SD. The neo-Hookean constitutive model overpredicted stress magnitudes at stretch values near unity and underpredicted stress magnitudes at smaller stress values. The Veronda Westmann constitutive model captured cartilage material nonlinearity
