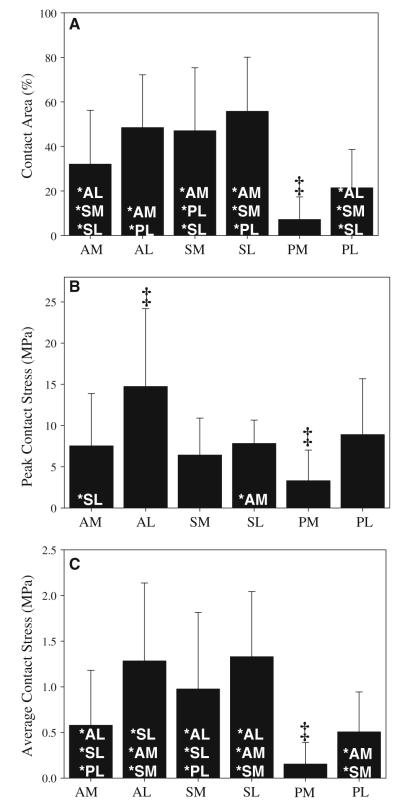
Fig. 9.
Contact area and contact stress VW average models. a Contact area. b Peak contact stress. c Average contact stress. Error bars SD. ‡Indicates p ≤ 0.05 against all other regions. *Indicates p ≤ 0.05 against listed region. Results were generally larger in the lateral regions and were smaller in the PM region

