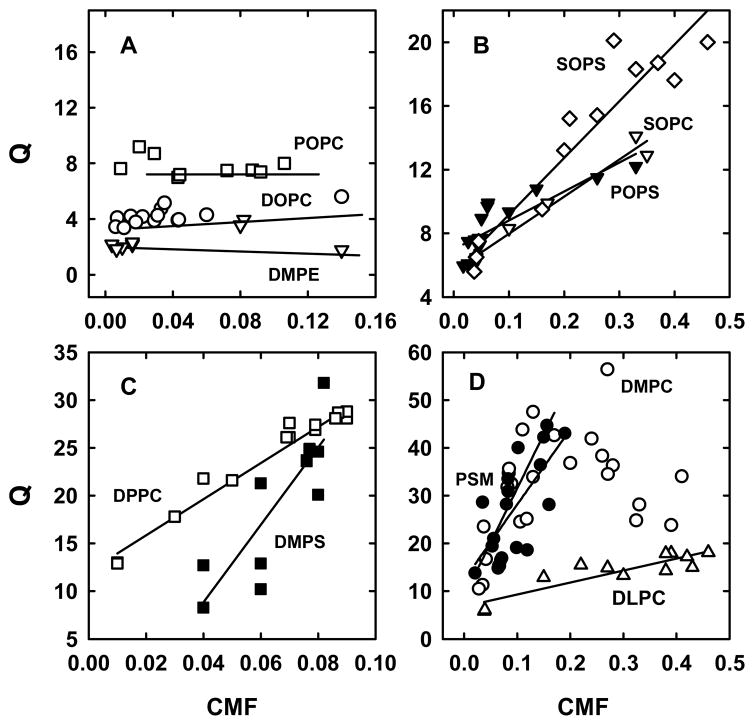
Figure 4.
Cholesterol distribution coefficients (Q) as a function of cholesterol mole fractions (CMF). Multiple experiments were performed for each curve by incubating 10 mM MBCD bearing 0.02 to 0.10 mM [14C]cholesterol with 0.1–1.0 mM LUV phospholipid for 0.5 h at 25 °C. Solid lines are linear least squares fits. Panel A, POPC (□); DOPC (○); DMPE (▽). Panel B, SOPS (◇); SOPC (▽); POPS (▼). Panel C, DPPC (□); DMPS (■). Panel D, DLPC (△); PSM (●); DMPC, with a linear fit to the portion with a positive slope (○).

