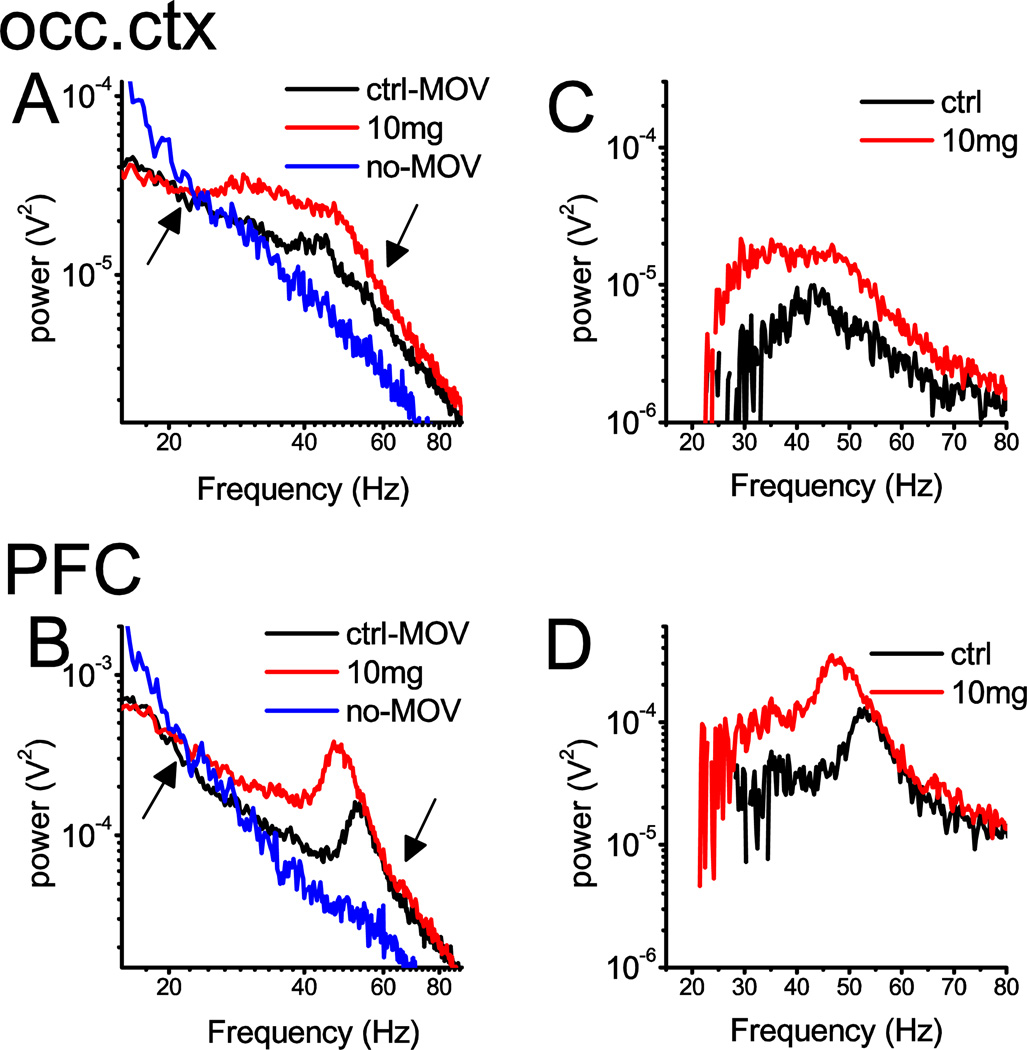
Figure 4.
Spectral characteristics of the changes in EEG induced by D4R activation in a MAM-treated rat. A and B. Power density spectra of field potential recordings in the occipital (A) and prefrontal (B) cortex, in pre-injection quiet waking/slow-wave sleep (blue; no-MOV), and active waking (black; MOV) and after drug injection (10 mg/kg A-412997)(red) between 15 and 90 Hz. Note 1/f-like PSD patterns associated with non-active states (blue) and two-segment composite PSDs in active waking (black) with a “knee” point at ~60 Hz, with a gamma peak at ~55 Hz riding on the top; note also crossing of the two spectra at ~20 Hz (marked by arrows). Spectral power increased between these two characteristic frequencies. C and D. Difference between PSD in active and quiet pre-injection control episodes (black; ctrl) and between post-injection EEG and quiet pre-injection control (red).

