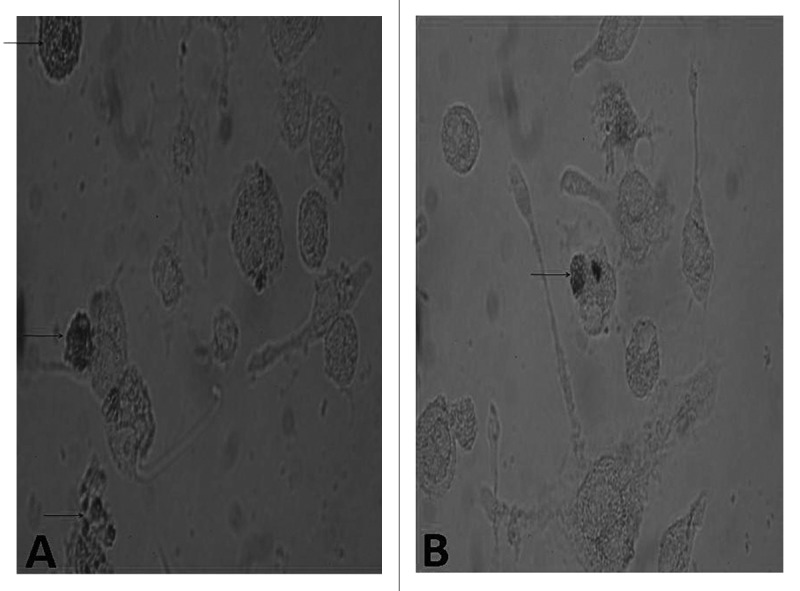
Figure 8. Comparison of FITC-dextran uptaking by immature and mature BMDCs. The BMDCs in different groups were prepared and compared in their ability to uptake FITC-dextran. A representative of three independent experiments was shown. The cells with lower FITC-dextran uptake were preincubated with LPS or NGP. For the analysis of dextran uptaking, the data for controls incubated at 4°C should be subtracted from the 37°C data. All data are represented as means ± S.E.M.(n = 3). *p < 0.05 vs. these in RPMI 1640. **p < 0.01 vs. those in RPMI 1640.
