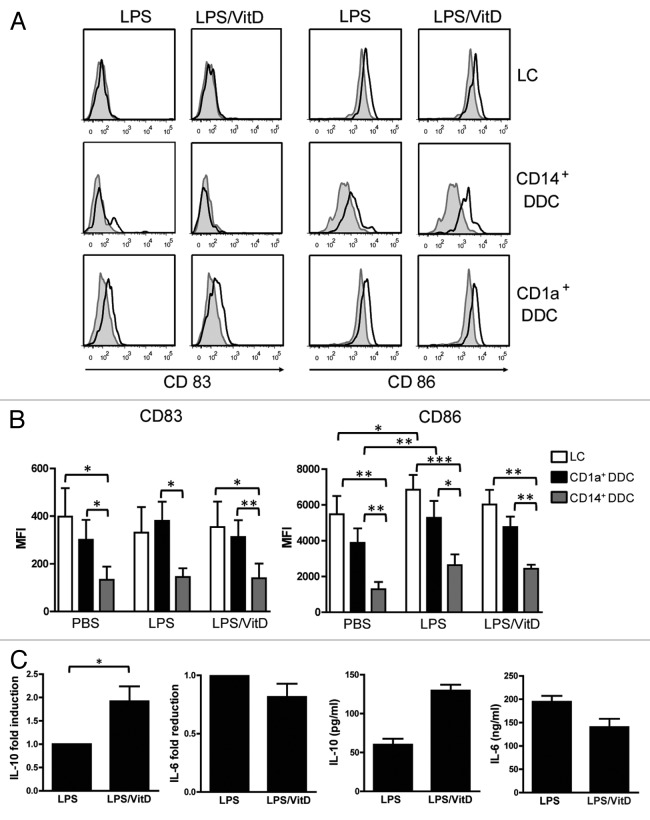
Figure 2. ID injection of VitD does not inhibit LPS-induced maturation and modifies cytokine production at the site of injection. The maturation status of migrating DC subsets was determined by the expression of CD86 and CD83. (A) Crawl-out cells were gated on HLA-DR+ and CD11c+ and the different DC populations were identified by their expression of CD1a and CD14. The expression of CD86 and CD83 by the three subsets following the injection of PBS (closed histograms), LPS or LPS/VitD (open histograms) were compared. (B) The mean fluorescence intensity (MFI) values of CD86 and CD83 by the three subsets: LCs (white bars), CD1a+ DDCs (black bars) and CD14+ DDCs (gray bars) were compared following the injection of PBS, LPS or LPS/VitD. (C) Fold induction of IL-10 or reduction of IL-6 (compared with LPS) in 72 h-culture medium of skin biopsies. Mean values of IL-10 and IL-6 produced in LPS condition, which was set to 1, were 113.66 ± 57.41 pg/ml for IL-10 and 126.85 ± 58.06 ng/ml for IL-6. Results are a representative of 6 (A and the two right graphs of C) or the mean ± SEM of 6 independent experiments (B and the two left graphs of C). *p < 0.05, **p < 0.01, ***p < 0.001.

An official website of the United States government
Here's how you know
Official websites use .gov
A
.gov website belongs to an official
government organization in the United States.
Secure .gov websites use HTTPS
A lock (
) or https:// means you've safely
connected to the .gov website. Share sensitive
information only on official, secure websites.
