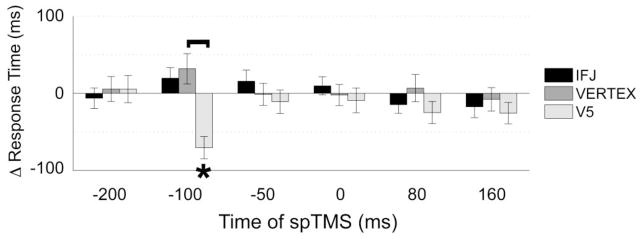
Figure 3.

Phase-based effects of spTMS on RT data. Following V5 spTMS, response times were differentiated based on the phase of the alpha cycle at spTMS onset. Error bars represent SE, Δ = alpha peak–alpha trough, brackets indicate significant differences between stimulation sites (p < 0.05), asterisks indicate significant differences based on whether spTMS occurred during an alpha peak or alpha trough (p < 0.05). Thus, a significant negative Δ RT at −100ms for V5 indicates a faster response (lower RT) following peak vs trough spTMS.
