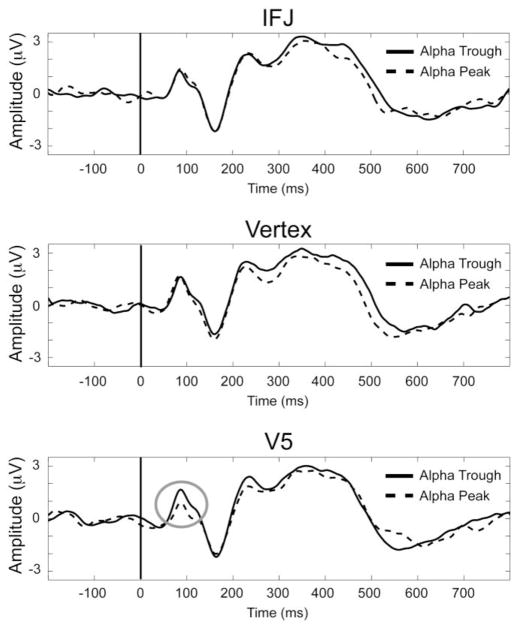
Figure 4.
ERPs to probe stimuli. Data shown are from trials where spTMS was applied 100 ms prior to encoded stimulus onset and averaged over left and right hemisphere regions of interest (see Fig. 4) from each stimulation site: IFJ (top), vertex (middle), and V5 (bottom). Effects of spTMS to V5 100 ms prior to WM encoding resulted in differential P1 amplitudes to probe stimuli (gray circle) based on the ongoing alpha phase during the TMS pulse.

