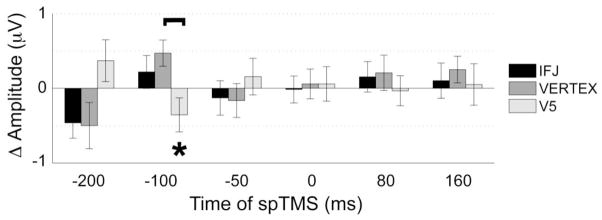
Figure 5.

Phase based effects of spTMS on P1 amplitude to probe stimuli. Similar to spTMS effects on RT (see Fig. 3), following V5 spTMS, the P1 amplitude was differentiated based on the phase of the alpha cycle at spTMS onset. Error bars represent SE, Δ = alpha peak – alpha trough, brackets indicate significant differences between stimulation sites (p < 0.05), asterisks indicate significant differences based on whether spTMS occurred during an alpha peak or alpha trough (p < 0.05).
