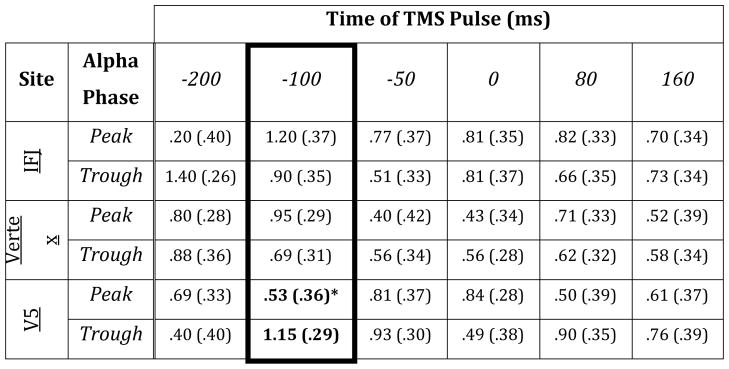
Table 2.
Mean (SE) P1 amplitude data per condition.

|
Planned comparisons were conducted on data when spTMS was applied 100 ms prior to stimulus onset (highlighted in black frame).
Numbers in bold font indicate significant differences at that TMS site between peak and trough data (p < 0.05).
