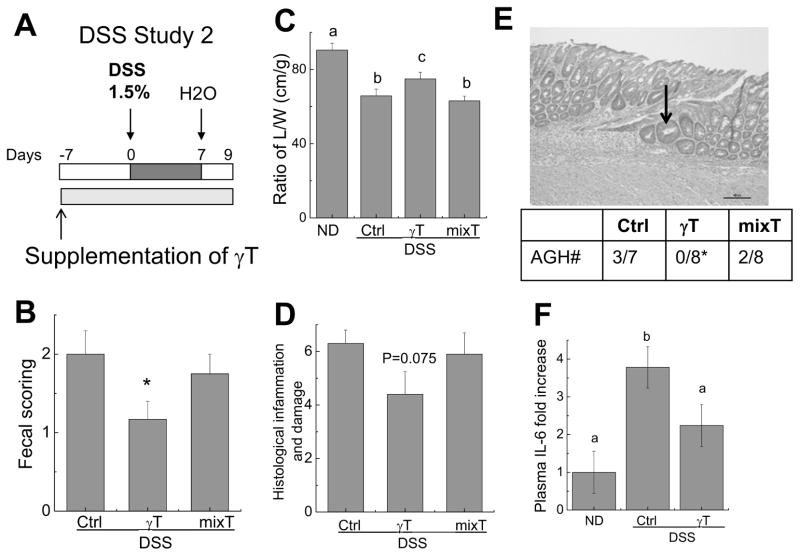
Figure 4. The effect of γT or mixed tocopherols on one cycle of 1.5% DSS-induced colon inflammation.
A: The design of DSS study 2; B–D: Effects of γT or mixed tocopherols on fecal scoring (B), the ratio of colon L/W (C), and histopathological scores for inflammation and damage in the colon (D); E: Histopathological identification of atypical glandular hyperplasia (AGH, indicated by an arrow). The table shows the incidence of AGH in each group. F: The effect on plasma IL-6. All results are means ± SEM (n = 7–12). *P < 0.05 indicates differences between control and γT group (B, E); Means without a common letter differ, P < 0.05 (C) and (F).

