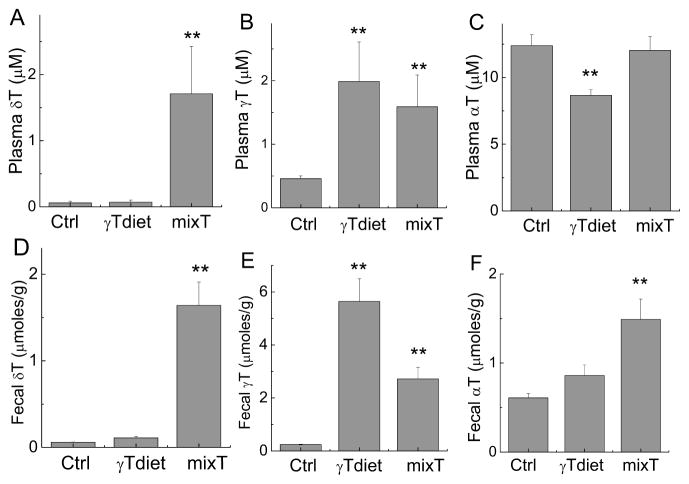
Figure 5. Tocopherols in the plasma and feces from mice in AOM-DSS study 2.
Plasma and fecal samples were extracted and tocopherols were measured by HPLC as described in the Materials and Methods section. **P < 0.01 indicates differences between mice fed with control diet and diets supplemented with γT or mixed tocopherols. Results are means ± SEM (n=5 per group).

