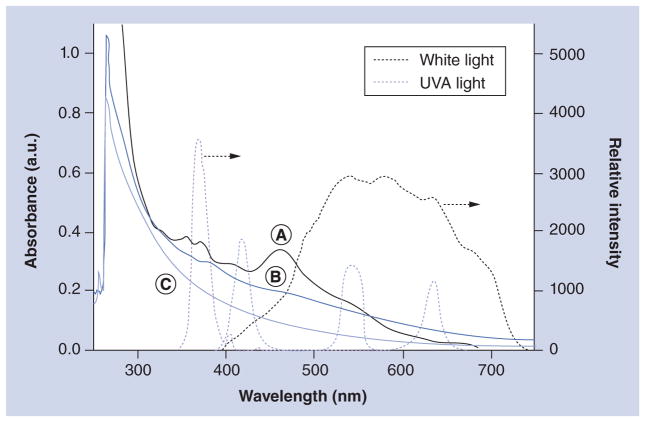
Figure 1. Correlation of UV–visible spectra of fullerenes to the emission spectra of light.
(A) C70[>M(t-Bu)2]; (B) C70[>M(C3N6+C3)2]-(I−)10 (LC17); and (C) C70[>M(C3N6+C3)2][>M(C3N6C3)2] (LC18). Samples of (A) and (B)/(C) were prepared in CHCl3 and dimethylformamide, respectively, at a concentration of 2.0 × 10⁻⁵ M.
a.u.: Arbitrary unit.

