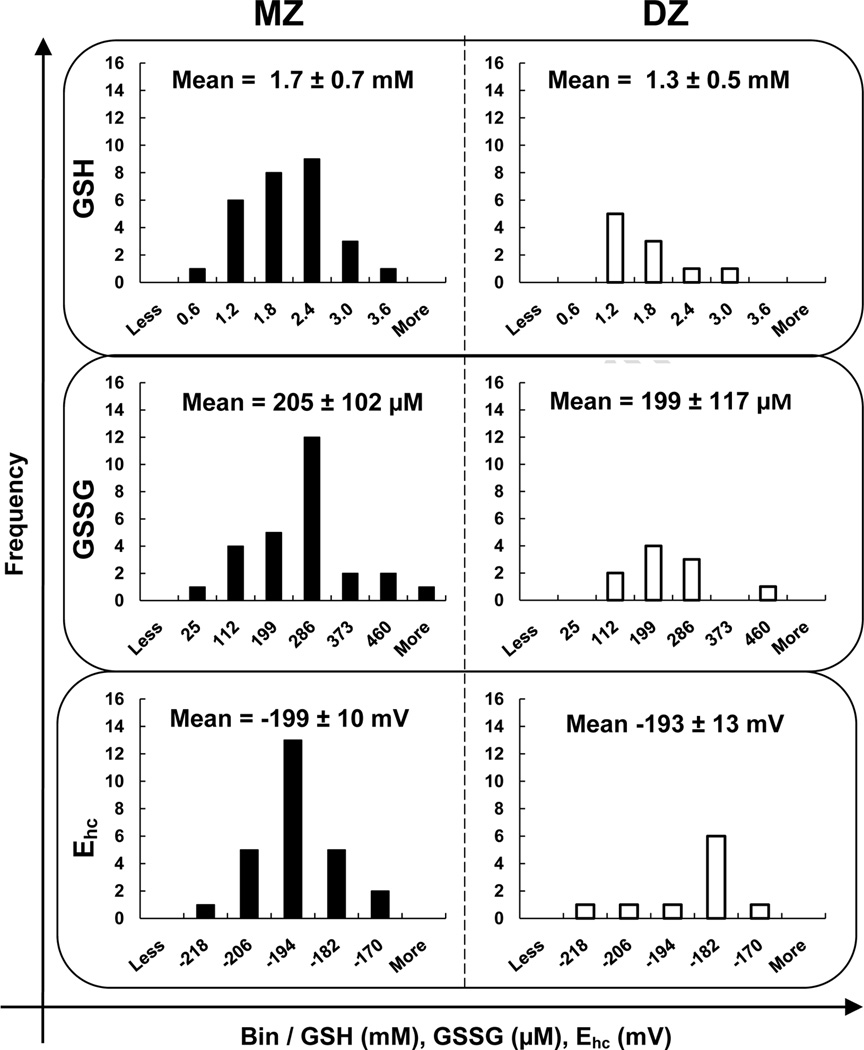
Figure 1. The distributions of GSH, GSSG, and Ehc are very similar between MZ and DZ twins.
The intracellular concentration of GSH for MZ and DZ twins combined is: median = 1.4 mM; mean = 1.5 mM; standard deviation = 0.7 mM; and range = 0.6 – 3.6 mM. GSSG is: median = 214 µM; mean = 224 µM; standard deviation = 114 µM; and range = 25 – 611 µM. The halfcell reduction potential is: median = −199 mV; mean = −197 mV; standard deviation = 11 mV; and range = −173 to −223 mV. Bins were equally distributed between the highest and lowest values of the whole study population (MZ + DZ). The difference was divided by 5 to assign the size of the bins (e.g. GSH bin “0.6 mM” contains those individuals with a GSH concentration between 0.6 mM and 1.2 mM). There is no statistically significant difference (Students t-test) between the means of the two groups for all three analytes. This indicates that the only difference between the MZ and DZ groups is the genetic similarity of pairs within the study population.

