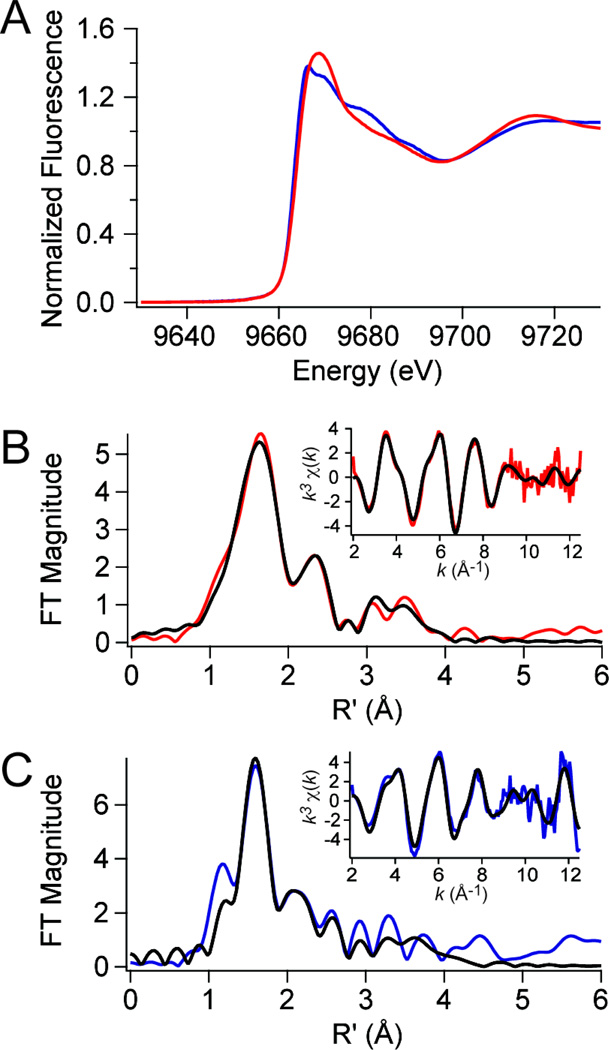
Figure 3.
Zn K-edge X-ray absorption spectroscopy of wild-type PsaRZn,apo (red traces) and PsaRZn,Mn (blue traces). (A) Zinc XANES spectra for each species. (B) Fourier-transformed EXAFS data (main panel) obtained for PsaRZn,apo (red trace) superimposed on best-fit coordination complex fits (black lines) as described by the parameters in Table 3. Inset, unfiltered k3-weighted EXAFS spectrum and fits for PsaRZn,apo. (C) Fourier-transformed EXAFS data (main panel) obtained for PsaRZn,Mn (blue trace) superimposed on best-fit coordination complex fits (black lines) (see Table 3). Inset, unfiltered k3-weighted EXAFS spectrum and fits for PsaRZn,Mn.

