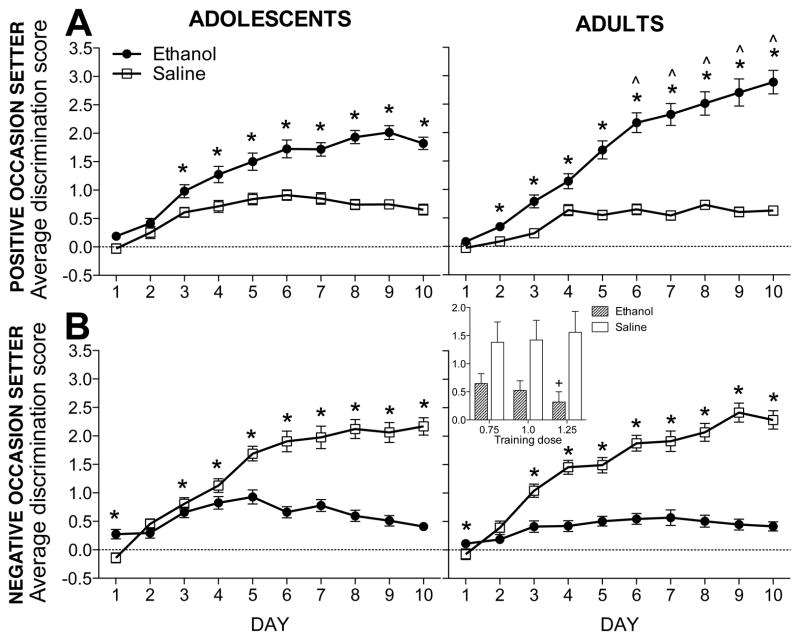
Figure 1. Average discrimination scores during acquisition.
Data shown are collapsed across training dose and time point. (A) For POS-trained subjects, ethanol session discrimination scores were significantly higher than saline sessions on days 3–10 for adolescents (n=45) and days 2–10 for adults (n=46) (indicated by *s). Additionally, adult ethanol session discrimination scores were higher than adolescent ethanol session discrimination scores on days 6–10 (indicated by ^s). (B) For NOS-trained subjects of both ages (adolescent n=35; adult n=38), saline session discrimination scores were higher than ethanol session discrimination scores on days 3–10, with ethanol session scores starting higher on day 1. Collapsed across age, subjects trained with 1.25 g/kg ethanol had lower discrimination scores than subjects trained with the 0.75 g/kg dose during ethanol sessions (indicated by +, inset).

