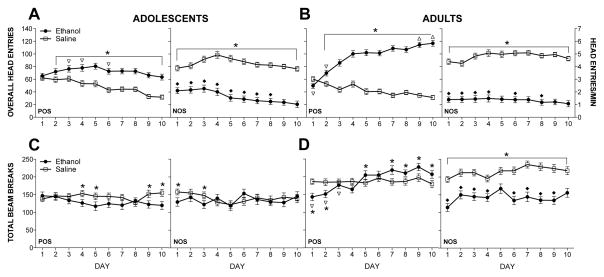
Figure 3. Overall head entries (A–B) and total beam breaks (C–D) during acquisition.
Data are collapsed across training dose and time point (POS n=45–46; NOS n=35–38). For both ages, significant differences on ethanol and saline sessions are indicated by *s. Values during non-reinforced sessions for NOS-trained subjects (ethanol-injected) that are lower than values during non-reinforced sessions for POS-trained subjects (saline-injected) are indicated by υs in comparisons conducted at each age. Values during reinforced sessions for POS-trained subjects (ethanol-injected) that differ from values during reinforced sessions for NOS-trained subjects (saline-injected) of the same age are indicated by σs (when lower than NOS) and ρs (when higher than NOS). For comparison to other discrimination studies that report head entry rates, the right y-axis (A–B) reflects head entries per minute.

