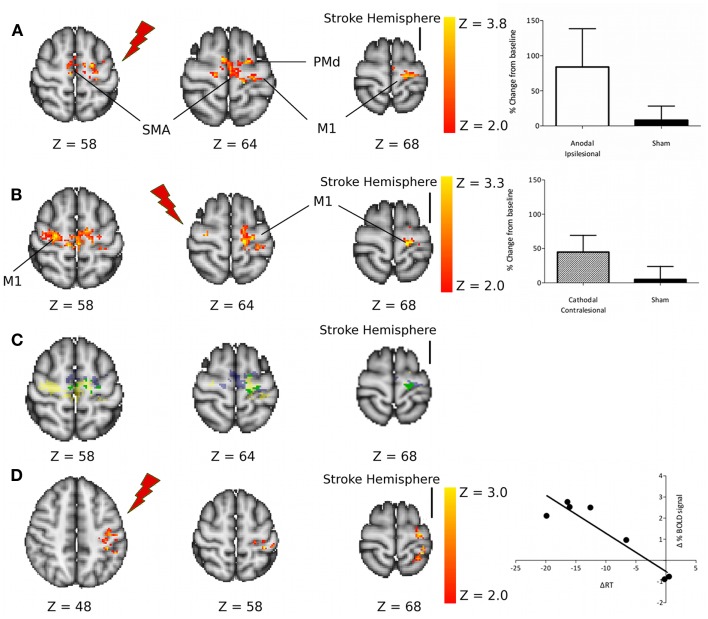
Figure 1.
(A) Regions of increased motor-related activation after anodal stimulation applied to the ipsilesional M1 compared with sham. The column graph (top right) shows the mean change in activity within these regions. (B) Regions of increased motor-related activation after cathodal stimulation applied to the contralesional M1 compared with sham. The column graph (center right) shows the mean change in activity within these regions. (C) Regions of increased motor-related activation after M1Ipsi anodal tDCS (blue), M1Cont Cathodal tDCS (yellow), and regions where these two effects overlap (green). (D) Regions of significant correlation between the change in motor-related fMRI signal due to M1Ipsi anodal tDCS and the tDCS-induced change in reaction times. M1, primary motor cortex; SMA, supplementary motor area; PMd, dorsal premotor cortex. Reprinted with permission from Figure 3, Stagg et al. (2012).

