Figure 3.
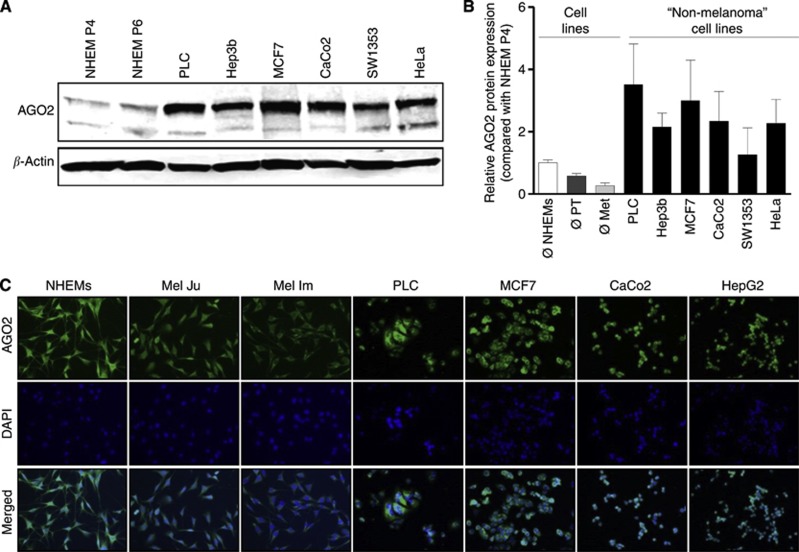
AGO2 expression in melanoma and ‘non-melanoma' tumours. (A) AGO2 western blots of NHEMs in passage 4 and 6 compared with six ‘non-melanoma' tumour cell lines indicate AGO2 reduction in NHEMs. (B) AGO2 western blot quantification display a high AGO2 expression in ‘non-melanoma' tumours in contrast to the lower amount of AGO2 in NHEMs and also to the strong reduced AGO2 expression in melanoma cell lines (PT=melanoma primary tumours, Met=melanoma metastases). (C) AGO2 immunofluorescence staining revealed strong AGO2 reduction in malignant melanoma compared with NHEMs and ‘non-melanoma' tumor cell lines.

