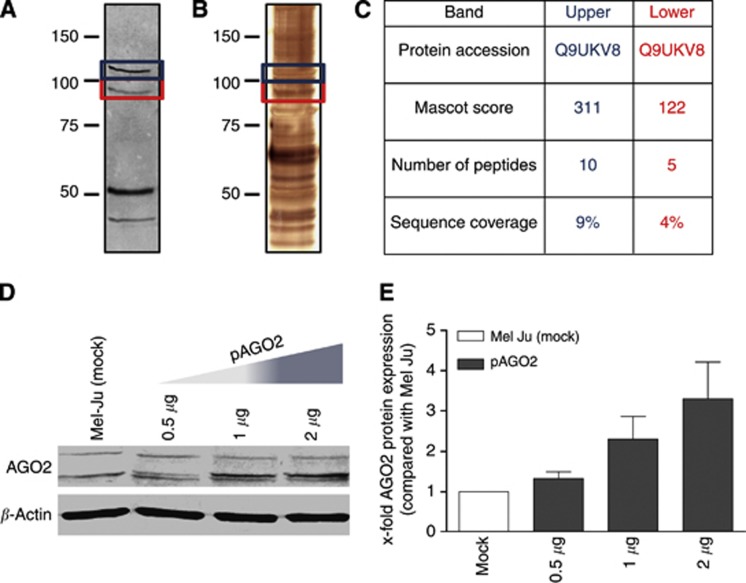
Figure 4.
AGO2 analysis and re-expression in melanoma. (A) AGO2 western blot analysis and (B) silver staining of a AGO2 co-immunoprecipitation sample from Mel Ju cells. The blue box marked the upper (∼115 kDa) AGO2 band and the red box the lower (∼99 kDa) AGO2 band. (C) Mass spectrometry analysis of AGO2 co-immunoprecipitation demonstrates that both bands contain AGO2. (D) AGO2 western blot analysis and (E) corresponding AGO2 western blot quantifications of Mel-Ju cells after pAGO2 or pIRES (ctrl) transfections with increasing plasmid concentrations (0.5, 1 and 2 μg). The full colour version of this figure is available at British Journal of Cancer online.

