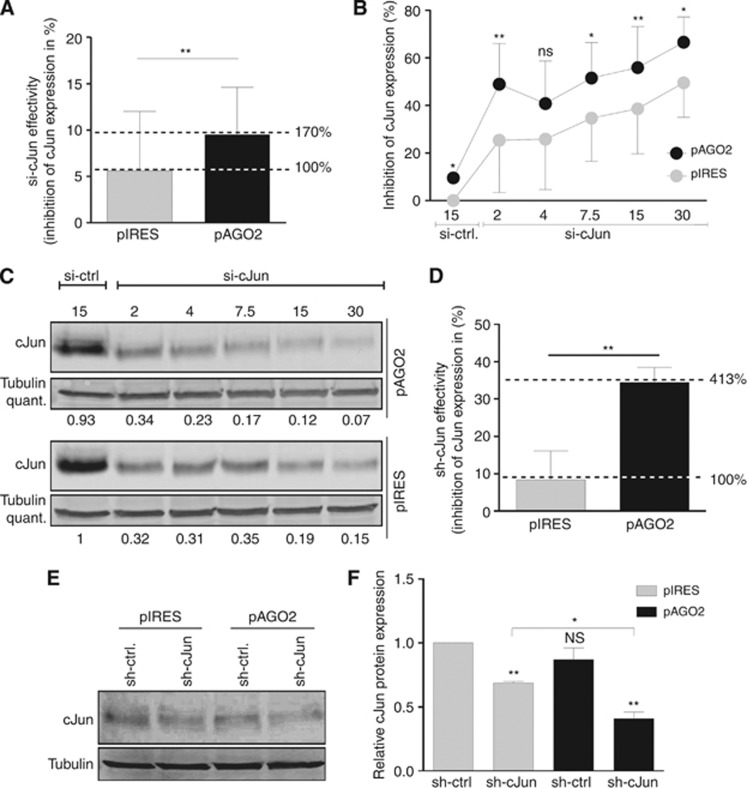
Figure 5.
si-cJun and sh-cJun activity in melanoma after AGO2 re-expression. (A) cJun-qRT–PCR analysis of Mel-Ju cells after 2 μg pAGO2 or 2 μg pIRES (mock) transfection and si-cJun treatment (cJun inhibition per pmol si-cJun). cJun inhibition increases after AGO2 re-expression up to 70% compared with mock. (B) cJun qRT–PCR (*P<0.05, **P<0.01) and (C) cJun western blot analyses demonstrate the increase of cJun inhibition in Mel Ju cells after pAGO2 (2 μg) or pIRES (2 μg) transfection and dose-dependent si-Jun (2, 4, 7.5, 15 and 30 pmol si-cJun and 15 pmol si-ctrl.) treatment. Tubulin was used as loading control. (D) cJun qRT–PCR analysis of Mel Ju cells treated with shRNA against cJun (2 μg pRS-cJun) or a control sh-RNA (2 μg pRS-ctrl.) demonstrate strong increased cJun inhibition after AGO2 re-expression (2 μg pAGO2) compared with mock (2 μg pIRES) transfected Mel Ju cells. (E) cJun western blot and (F) cJun western blot quantifications display the increase of cJun inhibition caused by sh-cJun (2 μg pRS-cJun) treatment in contrast to control cells (2 μg pRS-ctrl.) after AGO2 re-expression (2 μg pAGO2) compared with mock (2 μg pIRES) transfected cells. Tubulin was used as loading control.

