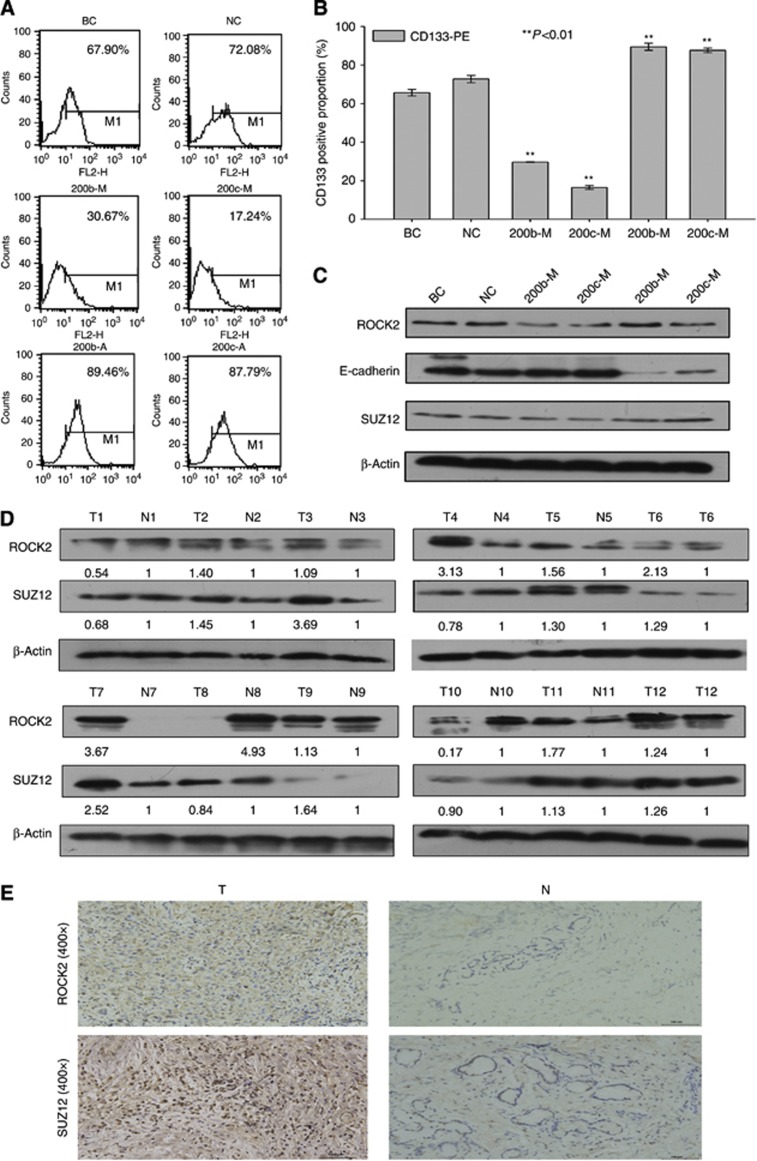
Figure 5.
(A) Proportion of CD133+ cells among transfected TFK-1 cells. At 48 h after transfection with miR-200b/c mimics/antagomir, the TFK-1 cells were resuspended, and the expression of CD133 was detected on the cell membrane. All the proportions are relative to the blank control and are shown in (B). (C) Protein expression of SUZ12, ROCK2, and E-cadherin. β-Actin was used as the control. All the data were compared with the data from the NC group. (D) Protein expression of SUZ12 and ROCK2 in 12 cholangiocarcinoma and matching normal bile duct tissues. (E) Immunohistochemistry of normal bile duct and cholangiocarcinoma tissues. The left and right images are the cholangiocarcinoma and normal bile duct tissues, respectively.

