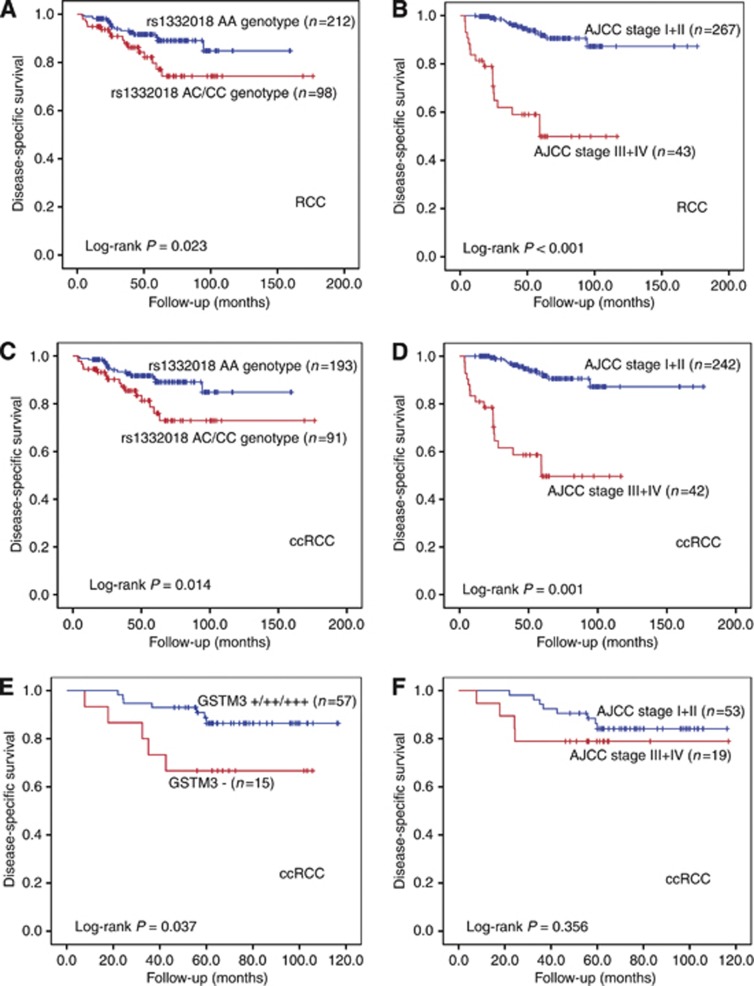
Figure 5.
Kaplan–Meier analysis of DSS of RCC patients with different rs1332018 genotypes or with different GSTM3 expression levels in adjacent renal tissues. (A) RCC patients with rs1332018 AA genotype vs those with the variant (AC+CC) genotype. (B) RCC patients at AJCC stages I+II vs those at AJCC stages III+IV. (C) ccRCC patients with rs1332018 AA genotype vs those with the variant (AC+CC) genotype. (D) ccRCC patients at AJCC stages I+II vs those at AJCC stages III+IV. (E) Positive GSTM3 expression vs negative GSTM3 expression in the adjacent renal tissues of the 72 ccRCC patients. (F) AJCC stages I+II vs those at AJCC stages III+IV of the 72 ccRCC patients.

