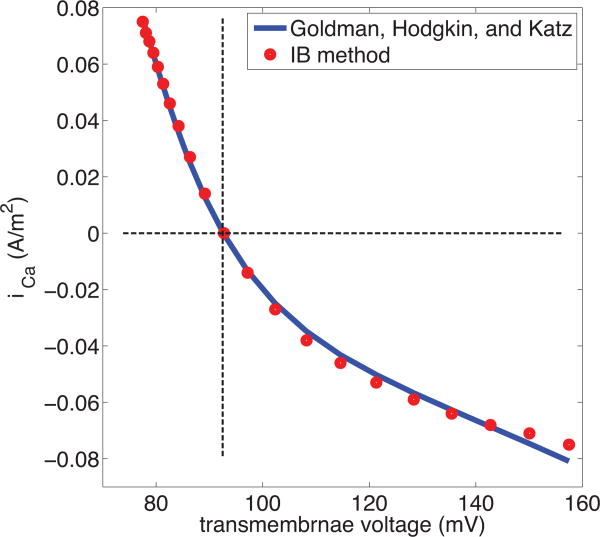
Figure 3. Current-voltage relationship of Ca2+with fixed chemical potentials.
The configuration of the simulation is described in the text. It involves two identical membranes, with an intracellular space between them, and an extracellular space external to them both. A uniform electric field drives current through the system. Since the two membranes face in opposite directions, the steady-state current has the same magnitude but opposite sign as measured through each of the membranes, thus providing two data points (red circles) on the current-voltage relationship. Transmembrane current is here considered positive when it flows from the extracellular to the intracellular space, and transmembrane voltage is measured as the voltage on the intracellular side of the membrane minus the voltage on the extracellular side. The blue curve is the prediction of the Goldman-Hodgkin-Katz formula. The horizontal line indicates zero current, and the vertical line indicates the transmembrane voltage (Nernst potential) at which zero current is expected to occur.

