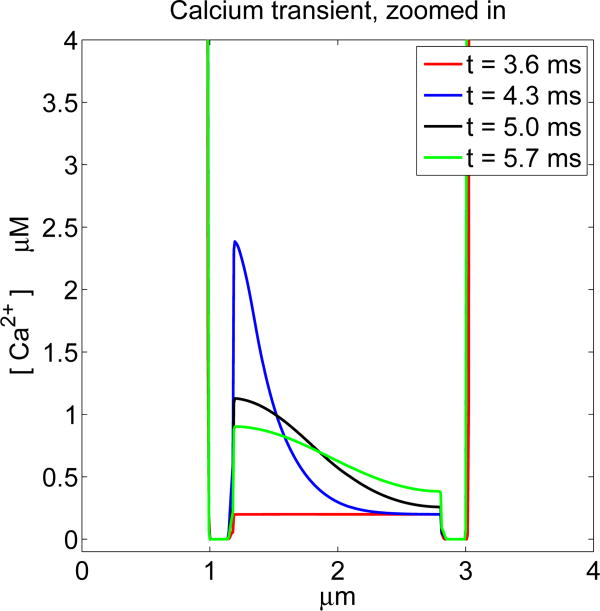
Figure 5.
Ca2+ concentration at selected times for a case in which the Ca2+ channel opens. The times shown are t = 3.6, 4.3, 5.0, 5.7 ms. The calcium channel opens at t = 2.07 ms and closes at t = 4.26 ms, but significant Ca2+ current does not begin to flow until the membrane repolarizes at t = 3.75 ms. Note the wave of intracellular Ca2+ concentration that progresses from left to right. The extracellular Ca2+ concentration is much too large to be seen on the scale of this plot.

