
Figure 1.
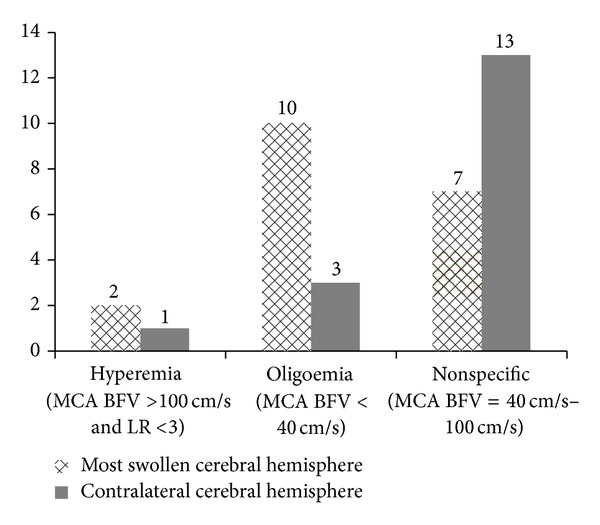
Hemodynamic patterns in the most swollen cerebral hemisphere and in the contralateral hemisphere (number of patients versus hemodynamic pattern in TCD). LR: Lindegaard ratio; MCA: middle cerebral artery; BFV: blood flow velocity; TCD: transcranial Doppler ultrasonography; All patients presented LR <3.