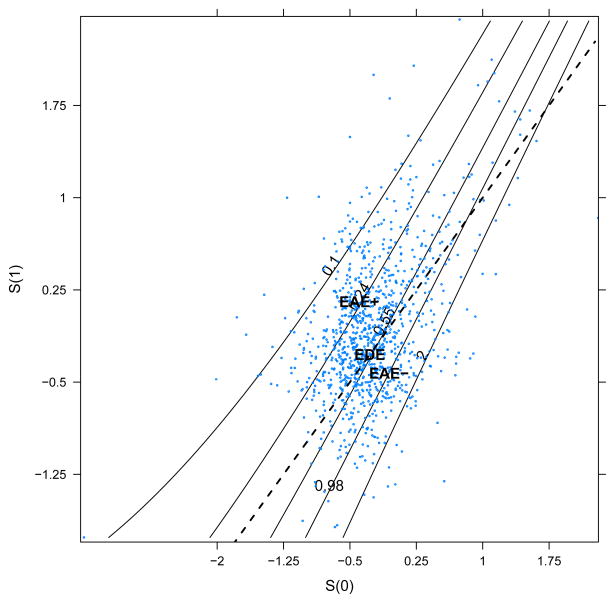
Figure 3.
Posterior mean CEP surface calculated with X set to the sample average from ACTG 320 and φ = 0.4. Scatterplot represents values of {S(0), S(1)} from one iteration from the Gibbs sampler, and dashed line is S(0) = S(1). Contours are placed at estimated relative risk of progression to AIDS or death in treatment vs. control arm.

