Figure 3.

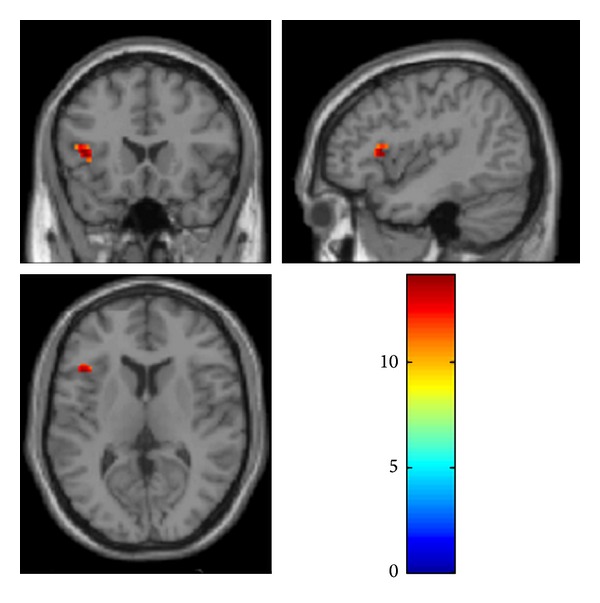
Activation map for main effect of time in the separate analysis of the POST HL group with ROI based on bilateral IFG showing activation of left IFG (Broca's area BA 45).

Activation map for main effect of time in the separate analysis of the POST HL group with ROI based on bilateral IFG showing activation of left IFG (Broca's area BA 45).