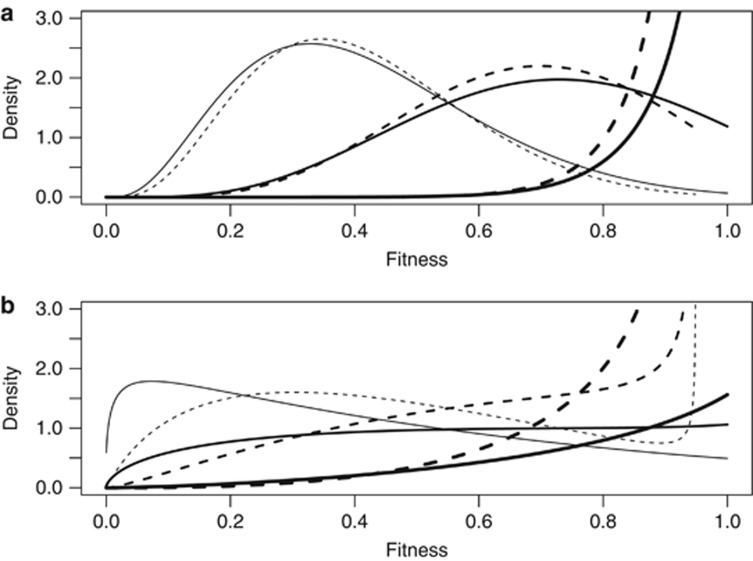
Figure 1.
Probability density functions for fitness f(W) (Equation 3) when fitness is a Gaussian function of trait value with width ω=3 and z is normally distributed with mean μz and s.d. σa. In both panels, μz=0 thick lines; μz=3 medium lines; μz=4.5 thin lines. Continuous lines, h2=1; corresponding dashed lines, h2=0.5, that is, when  . (a) σa=1. (b) σa=2.

