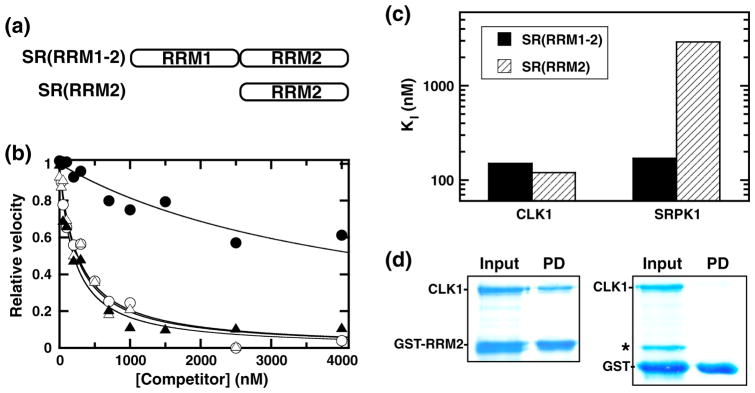
Fig. 4.

Binding of RRM constructs to CLK1. (a) Deletion constructs. (b) Competition experiments. Fixed amounts of SRSF1 (50 nM) are mixed either with CLK1 (10 nM) and varying amounts of SR(RRM1-2) (△) and SR(RRM2) (▲) or with SRPK1 (1 nM) and varying amounts of SR(RRM1-2) (○) and SR(RRM2) (●). The relative velocities for SRSF1 phosphorylation monitored using a filter-binding assay are plotted as a function of total competitor, and the appKI values are listed in Table 1. (c) Bar graph displaying KI values for SR(RRM1-2) and SR(RRM2) using CLK1 and SRPK1. (d) Pull-down of CLK1 by GST-RRM2. Input contains CLK1 with GST-RRM2 or free GST. Pull-down (PD) contains proteins on G-agarose beads after washing. Starred band represents an impurity, not pulled down by the beads.
