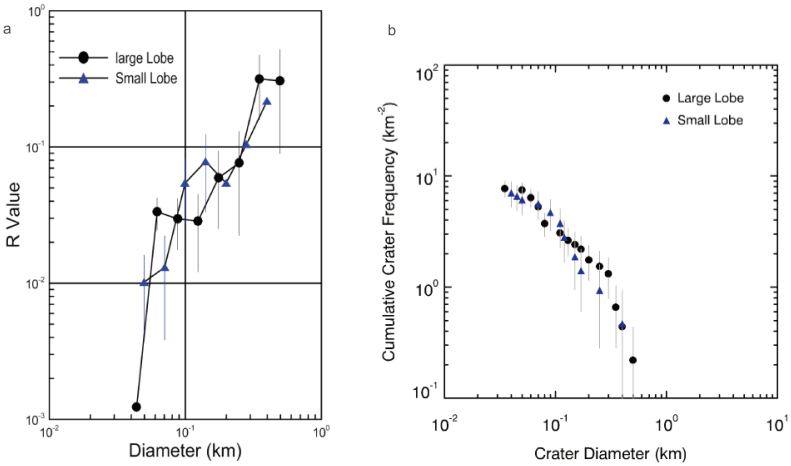
Figure 3.
(a) The relative size-frequency distribution for craters on Toutatis. (b) The cumulative size-frequency distribution for craters on Toutatis. In panel (a) R plot was devised by the Crater Analysis Techniques Working Group17 to better show the size distribution of craters and crater number densities for determining relative ages. The vertical position of the curve is a measure of crater density or relative age on the Toutatis: the higher the vertical position, the higher the crater density and the older the surface. In panel (b) x-axis stands for the crater diameter and y-axis represents the crater number larger than corresponding diameter on the investigated area. CSFD would easily inform that the size of craters distribute as diameters increase.

