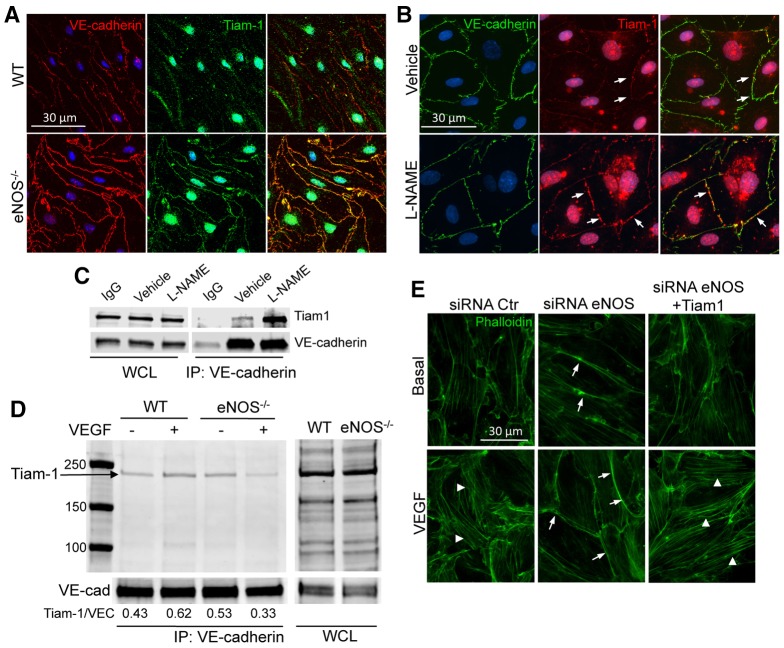
Fig. 5.
NO regulates VEGF-induced F-actin formation through TIAM1 localization to cellular junctions. (A) WT and eNOS−/− MLECs were plated onto glass coverslips, and were treated with 0.5% Triton X-100-containing buffer for 5 minutes on ice. The soluble fraction was removed and the ECs were gently washed with PBS before fixation with paraformaldehyde 4% and immunofluorescent staining of VE-cadherin (red) and TIAM1 (green). (B) Immunofluorescent co-staining of VE-cadherin (green) and TIAM1 (red) in HDEMCs plated on glass-bottomed dishes (MatTek) transfected with eNOS siRNA or control siRNA and treated with 0.5% Triton X-100-containing buffer for 5 minutes on ice. The arrows show TIAM1 at the junctions. (C) HDEMCs were treated with L-NAME or vehicle, and VE-cadherin was immunoprecipitated from the cell lysates. Western blotting for TIAM1 and VE-cadherin was carried out on the whole cell lysates (WCL) and on the immunoprecipitates (IP). (D) Basal and VEGF-stimulated primary WT and eNOS−/− MLEC lysates were subjected to immunoprecipitation of VE-cadherin and immunoprecipitates were analyzed by immunoblotting against TIAM1. The amount of TIAM1 co-immunoprecipitated was quantified and is reported as a ratio to VE-cadherin (VEC). (E) Immunofluorescent staining of F-actin (green) in HDEMCs transfected with eNOS siRNA or control siRNA, or co-transfected with eNOS siRNA and TIAM1 siRNA, serum starved and stimulated with VEGF (100 ng/ml) for 30 minutes. Arrows indicate cortical actin; arrowheads indicate stress fibers formed upon VEGF stimulation. The images have been captured with Zeiss Axiovert epifluorescence microscope and a 63× oil immersion objective, using Openlab software (Improvision, Lexington, MA). Data are representative of three independent experiments.

