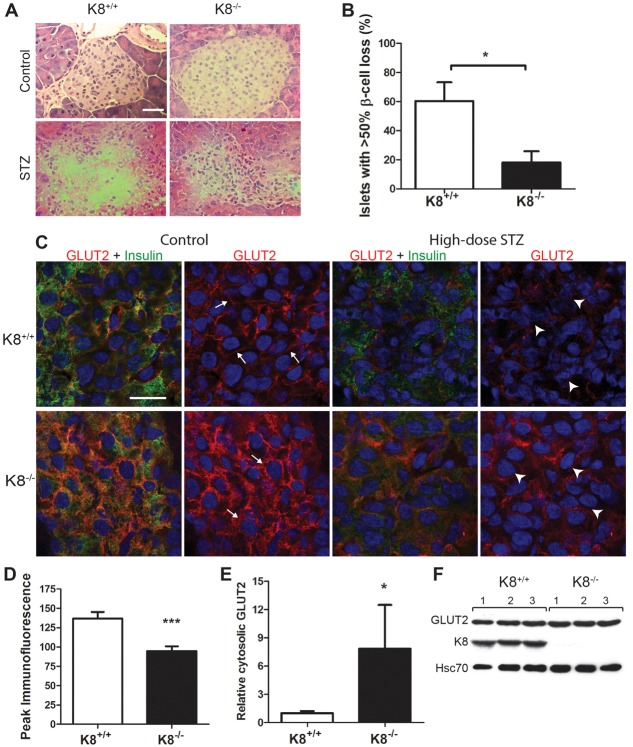
Fig. 4.
Decreased sensitivity to high-dose STZ-induced islet damage corresponds with basal GLUT2 mislocalisation in K8−/− mice. (A) Hematoxylin-eosin staining of pancreatic sections of untreated and high-dose STZ-treated K8+/+ and K8−/− mice 48 hours after STZ. Islet β-cells are almost entirely lost in K8+/+ mice, but better preserved in K8−/− mice after STZ treatment. Scale bar: 50 µm. (B) Percentage of islets in K8+/+ (white bar) versus K8−/− (black bar) mice with extensive β-cell loss after high-dose STZ. Bars represent means±s.e.m., n = 4 per group. *P<0.05 as calculated with the Student's t-test. (C) Confocal images of immunostaining for GLUT2 (green), insulin (red) and cell nuclei (blue) in islet β-cells from untreated and high-dose STZ-treated K8+/+ and K8−/− mice, 48 hours after STZ. The white arrows exemplify sites of distinctly membrane-proximal GLUT2 localisation in untreated K8+/+ β-cells and the increased cytoplasmic GLUT2 in K8−/− β-cells. The white arrowheads exemplify the apoptotic-looking β-cell nuclei in STZ-treated K8+/+ mice and intact nuclei in STZ-treated K8−/− β-cells. Scale bar: 20 µm. (D) The peak immunofluorescence intensity for GLUT2 between adjacent β-cell nuclei was assessed by quantification from confocal images. K8−/− GLUT2 peak immunofluorescence intensity over a distance between the nuclei of two adjacent β-cells is on average lower compared with K8+/+ indicating decreased GLUT2 at the cell–cell interfaces. The bars represent mean± s.e.m. values of the GLUT2 fluorescence peak (or maximum amplitude) calculated for 30 K8+/+ and 30 K8−/− β-cell pairs (see examples in supplementary material Fig. S4), n = 4 mice per genotype. (E) Relative GLUT2 levels determined by western blotting in the cytoplasmic fraction from crude islet lysates normalised to Hsc70 for K8+/+ (white bars) and K8−/− (black bars) mice (n = 4 per group). (F) Western blots from total pancreas lysates showing GLUT2, K8 and the loading control Hsc70 protein bands for three untreated K8+/+ and K8−/− mice (1–3). The difference in relative GLUT2 levels after normalisation with Hsc70 were statistically insignificant, measuring 0.80±0.07 in K8+/+ and 0.71±0.03 in K8−/− mice (mean±s.e.m.)

