
Fig. 1.
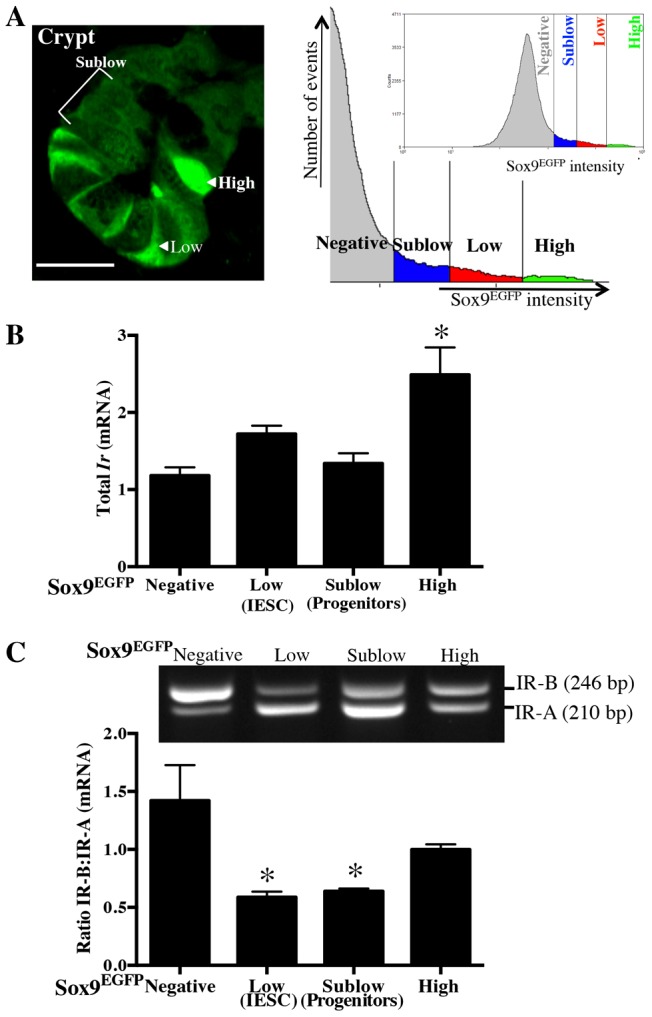
Insulin receptor isoform expression in intestinal epithelial cells exhibits a gradient from proliferative stem cells (IR-A predominant) to post-mitotic differentiated lineages (IR-B predominant). (A) Immunofluorescence image of jejunal crypt and FACS histogram with representative gates generated from Sox9-EGFP reporter mouse illustrating distinct Sox9-EGFP expression levels in intestinal epithelium. Prior studies (Van Landeghem et al., 2012) validated the Sox9-EGFPLow as IESCs, Sox9-EGFPSublow as progenitors, Sox9-EGFPHigh as EECs, and Sox9-EGFPNegative as enterocytes and other differentiated lineages. Labels indicate representative cells. Scale bar: 20 µm. (B) Levels of total Ir mRNA assayed by qRT-PCR on different Sox9-EGFP populations isolated from jejunum by FACS as previously reported (Van Landeghem et al., 2012). n≧3 animals. (C) Representative gel from RT-PCR assesses the ratio of IR-B∶ IR-A mRNAs (top) using primers spanning exon 11 of the Ir (present only in IR-B) and quantitative data across independent animals (n = 6). Data in B and C represent mean ± s.e.m. *P<0.05 compared with Sox9-EGFPNegative cells; ANOVA, Sidak's Test.