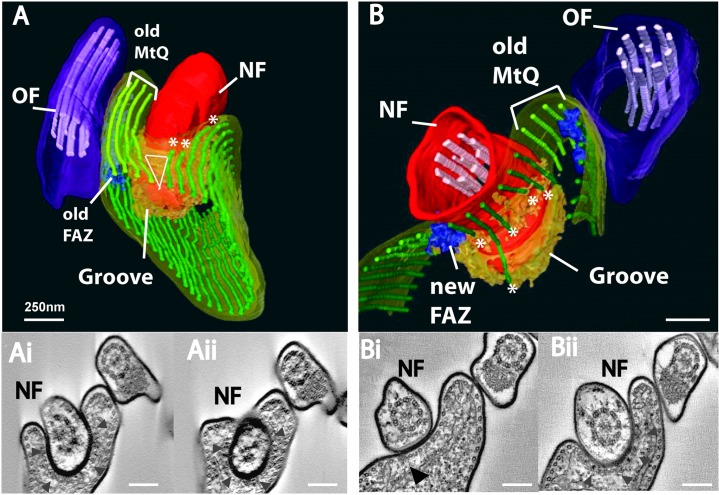
Fig. 2.
The subpellicular microtubule cytoskeleton is remodeled during new flagellum growth. (A,B) Surface renderings of segmented data and selected tomogram slices of two serial section tomograms illustrate the remodeling of subellicular microtubules that surround the groove and the close association of the old MtQ with the groove. (A) Remodeling of subpellicular microtubles anterior to the groove. The subpellicular microtubule array (green), old FAZ (blue), old MtQ (light green), new flagellum (NF) and old flagellum (OF) are shown. A punctuate electron density underlies the cytoplasmic face of the groove (orange). Asterisks mark the subpellicular microtubules that terminate within the tomogram. The triangle illustrates modification of spacing between subpellicular microtubules anterior to the groove. (Ai, Aii) z-slices from the tomogram that was used to produce the model shown in A, each slice is ∼6 nm thick. The groove is highlighted (arrowheads). (B) Remodeling of subpellicular microtubules posterior to the groove illustrating terminating subpellicular microtubules (asterisks) and the new FAZ posterior to the groove. The groove is located immediately to the right of the old MtQ. (Bi, Bii) z-slices from the tomogram that was used to produce the model shown in A; each slice is ∼6 nm thick. The FAZ associated with the new flagellum and the groove are indicated on the tomogram data. Scale bars: ∼250 nm.

