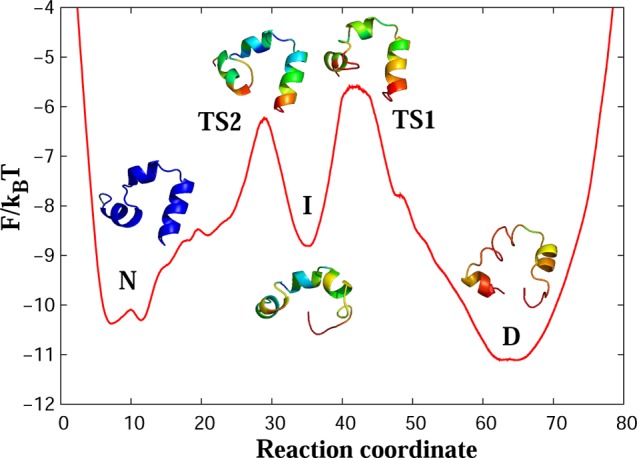
Figure 1.

Free-energy profile for wild-type villin (HP35) along the putative optimal reaction coordinate. [Legend: D, the denatured basin; I, the intermediate basin; N, the native basin; TS1, the first transition state; and TS2 the second transition state.] The main folding barrier between D and I states is ΔF/kBT ≈ 5.5. The representative structures for the regions of the landscape show a trajectory snapshot closest to the average structure of the region. Colors code the root-mean-square (rms) fluctuations of atomic positions around the average structure from 1.5 Å (blue) to 7 Å (red).
