
Figure 5.
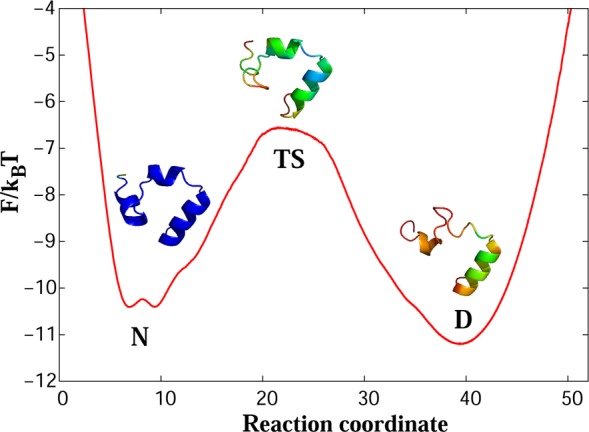
(A) Free-energy profile for the Nle/Nle mutant along the optimal reaction coordinate. D and N denote the denatured and native basins, respectively, while TS denotes the transition state.
Official websites use .gov
A
.gov website belongs to an official
government organization in the United States.
Secure .gov websites use HTTPS
A lock (
) or https:// means you've safely
connected to the .gov website. Share sensitive
information only on official, secure websites.
(A) Free-energy profile for the Nle/Nle mutant along the optimal reaction coordinate. D and N denote the denatured and native basins, respectively, while TS denotes the transition state.