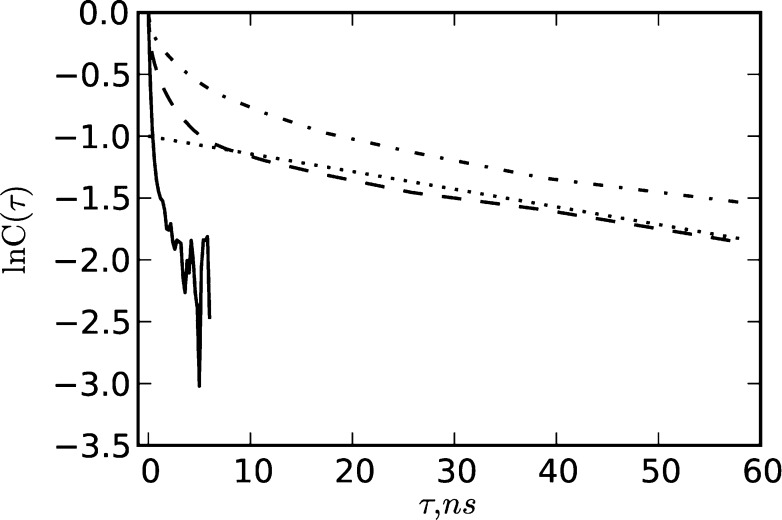
Figure 9.
Plot of the position autocorrelation function in the native (N) state (dashed line), the denatured (D) state (dash-dotted line), and the transition state (TS) (solid line). Dotted line shows ln C(τ) = −1 – τ/70, which is an autocorrelation function with a time decay τcorr = 70 ns to mimic the experiment.34

