
Figure 2.
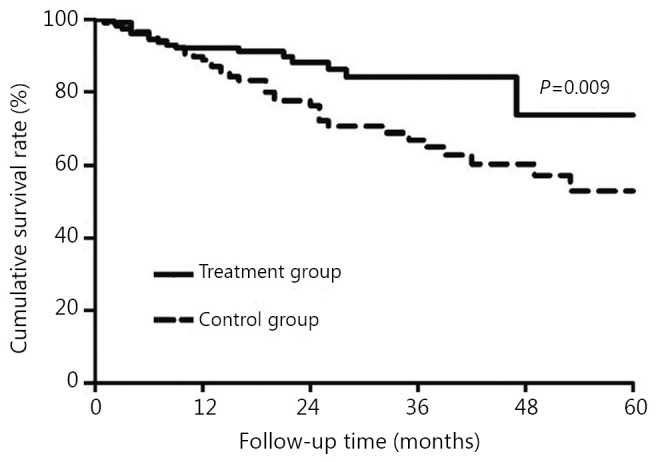
Comparison of cumulative OS rates between the treatment group and the control group (P<0.05) after PSM.
Official websites use .gov
A
.gov website belongs to an official
government organization in the United States.
Secure .gov websites use HTTPS
A lock (
) or https:// means you've safely
connected to the .gov website. Share sensitive
information only on official, secure websites.
Comparison of cumulative OS rates between the treatment group and the control group (P<0.05) after PSM.