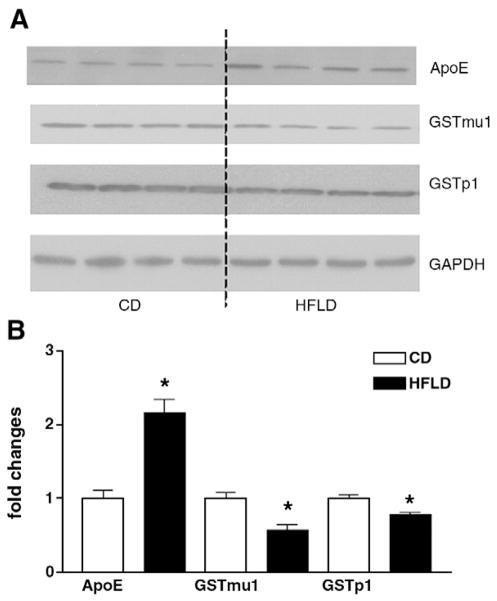
Fig. 4.
Conformation of the 2D-DIGE results by Western blot analysis. (A) ApoE, GSTp1 and GSTmu1 proteins were selected to confirm 2D-DIGE results by Western blot analysis. (B) The intensity of protein bands was quantified by densitometry using the NIH Image software (NIH, Bethesda, MD, USA). For changes in protein level, ratios of the respective protein to GAPDH, as a housekeeping protein, and densitometric values were compared between HFLD- and CD-fed mice by Student’s t test.

