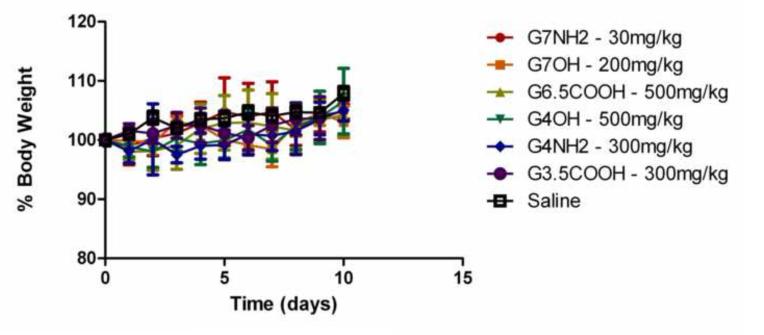
Figure 2.
Animal weight monitored over ten days as part of the oral acute toxicity study. Six different PAMAM dendrimers were administered orally to a group of five CD-1 mice and their percentage body weight is shown in the graph. Dosages shown here are the respective maximum tolerated doses for each treatment group. Each point in the graph represents Mean ±S.D.

