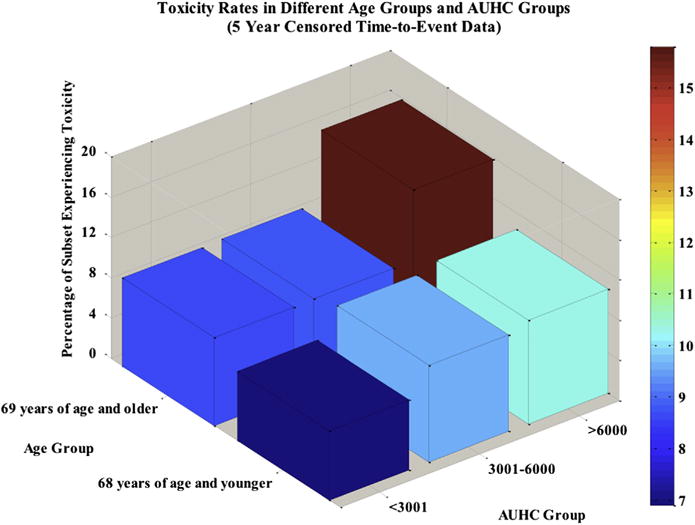
Fig. 3.

Percentage of patients experiencing toxicity increases with wall area under the histogram curve (AUHC) within each age group. The group experiencing the greatest rates of toxicity was patients older than 68 years of age with an AUHC above 6000. The group experiencing the lowest rates of toxicity was patients 68 years of age and younger with an AUHC less than or equal to 3000.
