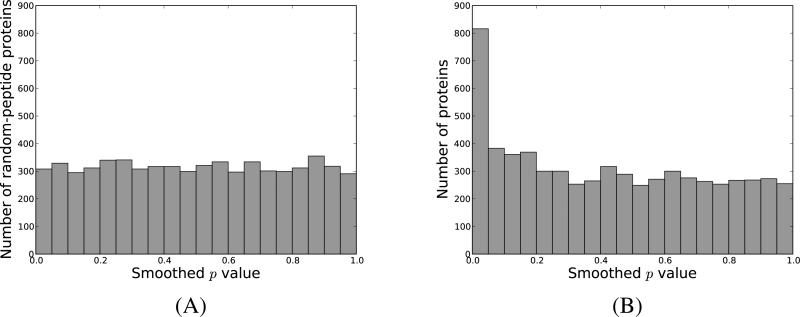
Figure 2. PFM-derived protein p value distribution for yeast-01.
We assigned for each protein a p value describing the probability that an incorrect protein would get a similar, or more extreme configuration of peptides matched to MS1-features. In (A) we display the histogram of the p values obtained for incorrect proteins composed of random peptides, while in (B) we display the p values for the proteins present in the yeast database.

