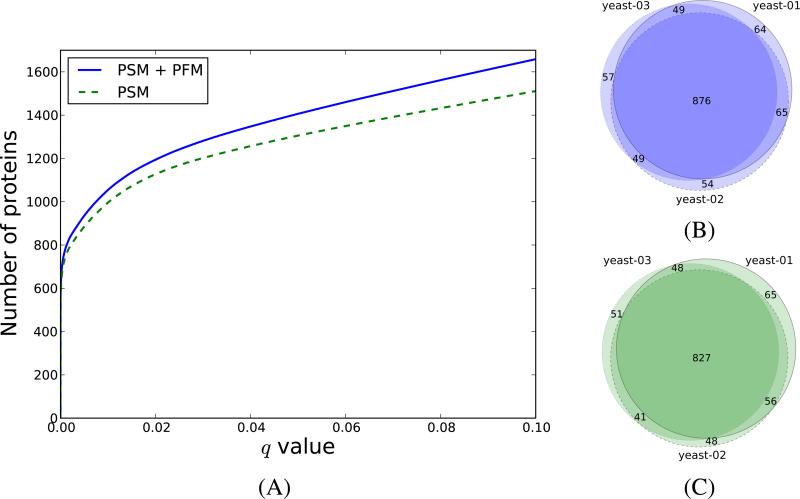
Figure 4. The PFM level information increases the number of protein identifications.
In (A) we display the number of proteins as a function of the PSM-derived q values (dashed line), and combined PFM+PSM-derived q value (solid line) for the yeast-01 dataset. In (B) and (C) we show the overlap between the yeast proteins identified at q < 0.01 when using the in silico AMT workflow, and when using only the PSMs, respectively.

