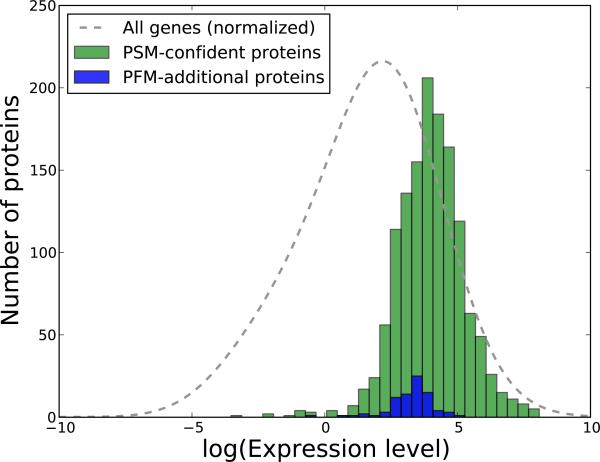
Figure 6. Comparison of the transcript levels of PSM-derived and PSM+PFM-additional protein identifications.
We have processed a publicly available dataset corresponding to mRNA profiling via high-throughput sequencing for the DU145 cells. In green we display the estimated transcript levels of the proteins confidently identified from the fragmentation spectra, and in blue the transcript levels of the additional proteins obtained with the in silico AMT method. The abundance levels are expressed as Fragments Per Kilobase of transcript per Million mapped reads (FPKM), and for a better visualization are given on a logarithmic scale. As a consequence, the proteins that had estimated transcript levels of 0.0 were removed (25 proteins for the PSM-proteins and 1 for the PFM-proteins). The gray line illustrates the transcript levels of all the genes, and was generated by kernel density estimation with the bandwidth set using Silverman's rule of thumb, and the values normalized to match the other two distributions. The figure corresponds to the human-01 dataset, and Supplementary Figure 12 displays similar representations for the other two human runs.

