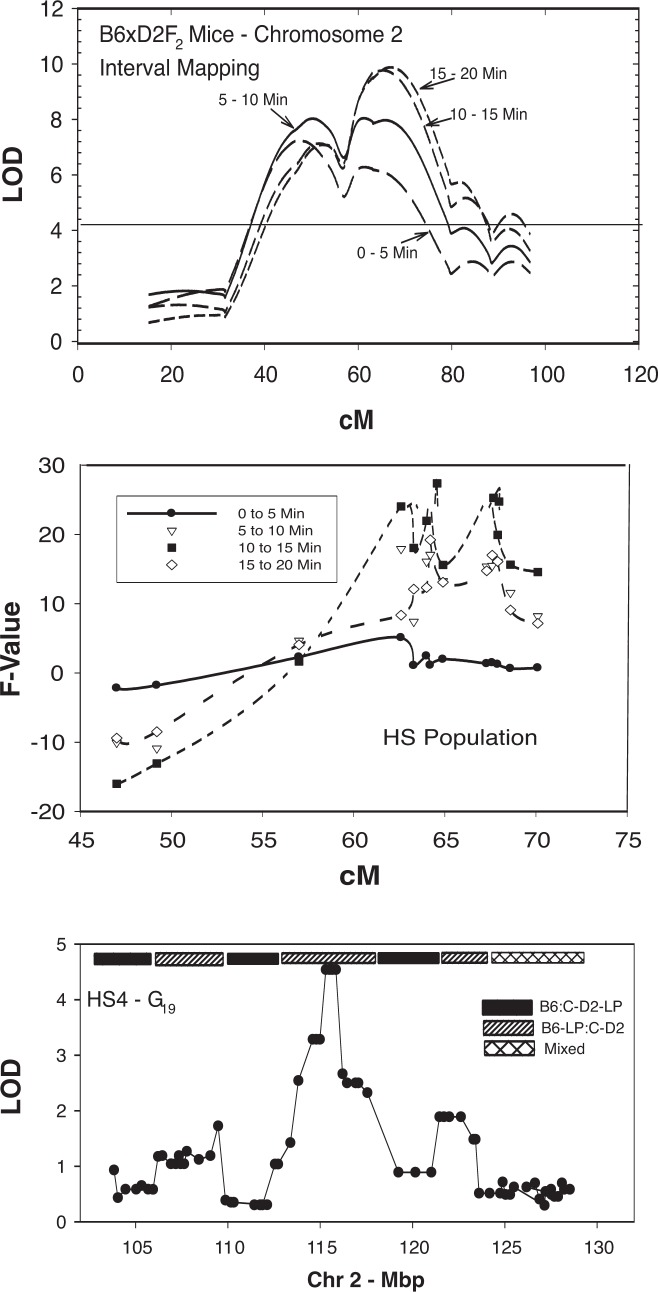
Figure 15.
Three strategies for mapping a quantitative trait locus (QTL) on mouse chromosome 2 that is associated with acute ethanol locomotor response. The characteristic (i.e., phenotype) tested is the difference in activity between the administration of saline and the administration of 1.5 g/kg ethanol, measured in 5-minute intervals between 0 and 20 minutes after the injection. The top panel illustrates the result of a QTL mapping analysis in a C57BL/6J × DBA/2J F2 intercross (N = 600) (Demarest et al. 1999). The second panel illustrates mapping of the same phenotype in heterogeneous stock [HS-NPT] mice (N = 500) at generation 32 (Demarest et al. 2001). Data were analyzed in a marker-by-marker design; all markers were microsatellites and were classified as C57BL/6J–like or different. A positive F value indicates that a non-C57 allele is associated with an increased ethanol response. The HS analysis detected several QTLs that were not found in the F2 intercross analysis. The bottom panel shows the results of mapping the same phenotype using heterogeneous stock [HS4] animals (N = 575) at generation 19 and using a panel of closely spaced SNPs as markers (Malmanger et al. 2006). The bar at the top shows the haplotype structure across the region of interest.
NOTE: The LOD (logarithm [base 10] of odds) is a measure of the degree of linkage between a given DNA region or gene and a specific trait.

