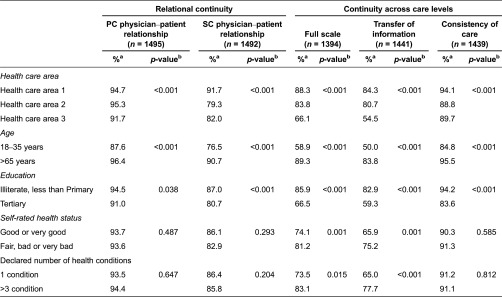
Table 5.
Differences in scores between subgroups

aPercentage of patients perceiving high or very high continuity of care.
bP-value associated for Chi-square test comparing very high, high, low and very low perceptions of continuity of care among groups.
IC, informational continuity; MC, managerial continuity; PC, primary care; RC, relational continuity; SC, secondary care.
