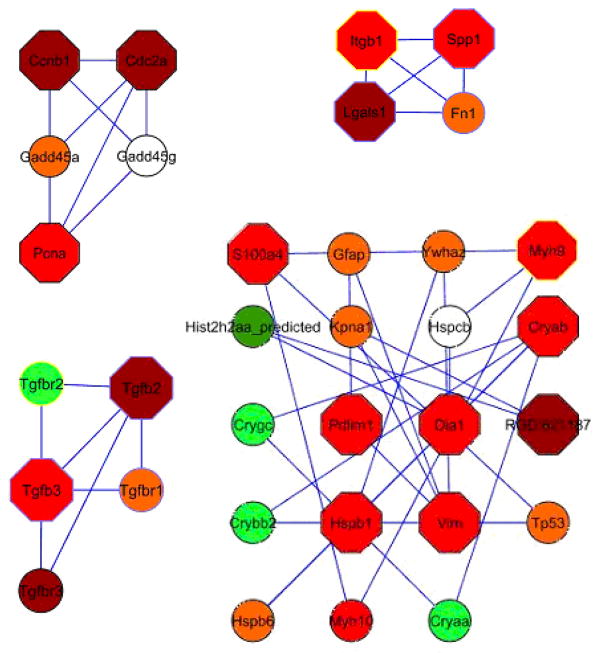
Figure 3. Protein interaction modules.
Graphical visualization of the top four network modules. Node fill colour indicates the measured fold-change, where green represents down regulated genes (light green < −1.5, dark green < −2) and red represents upregulated genes (orange <1.5, red >1.5, dark red >2). The node’s border colour indicates the subcellular localization of the protein (yellow for membrane and blue for extra cellular). Hexagon shape of the node represents DEGs and circular shape represents direct interacting proteins.

