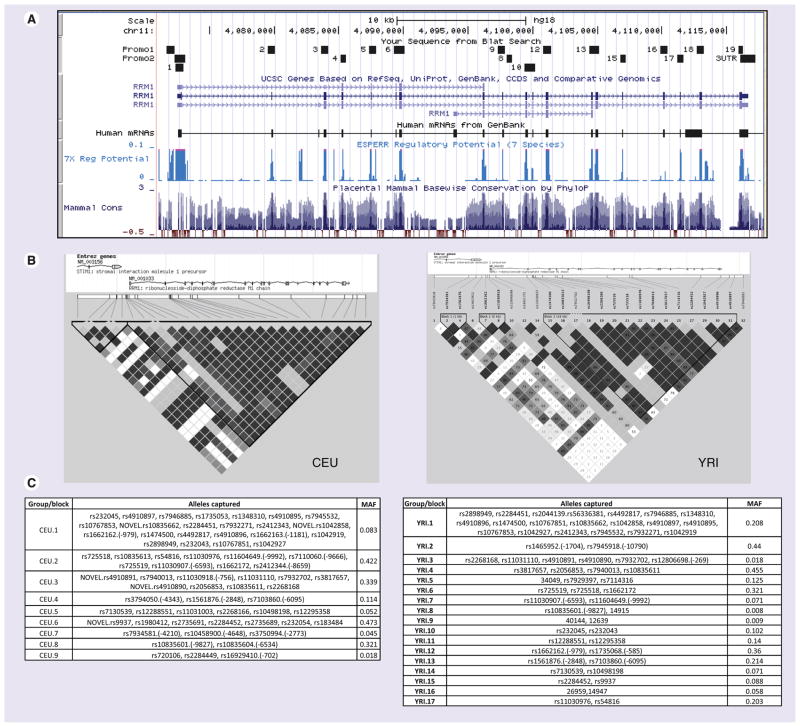
Figure 1. SNPs in RRM1.
(A) Snapshot from the UCSC genome browser [NCBI/hg18 (2006)] for the RRM1 locus. The regions sequenced in HapMap panels are shown by small boxes. (B) Linkage disequilibrium plot of RRM1 gene in European (CEU) and African (YRI) ancestry samples generated in Haploview using genotype data from the present study and from HapMap for both CEU and YRI samples from 10 kb upstream to 5 kb downstream. (C) SNPs that are linked, r2 > 0.8 (and picked by the tagger program), are categorized in the same groups. SNPs without rs numbers are indicated by number corresponding to Table 1.
CEU: Utah residents with northern and western European ancestry; MAF: Minimum allele frequency; YRI: Yoruba people in Ibadan, Nigeria.

