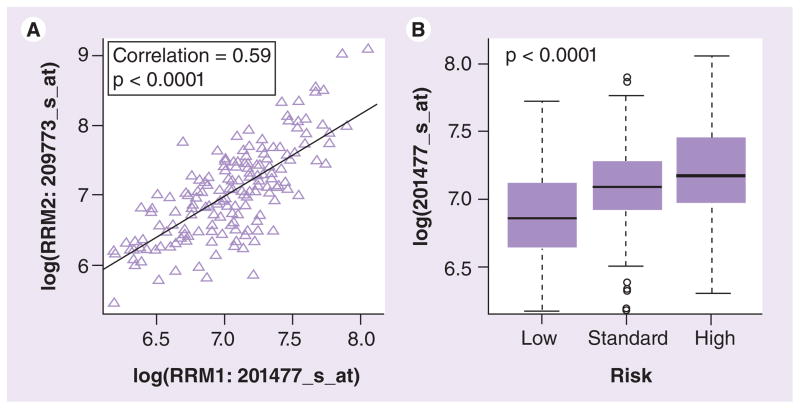
Figure 6. Comparison of RRM1 and RRM2 mRNA expression in diagnostic leukemic blasts from acute myeloid leukemia patients.
(A) RRM1 and RRM2 expression was extracted from Affymetrix U133A microarray data and correlation of mRNA expression levels between RRM1 and RRM2 was evaluated. (B) Box plot showing association of RRM1 expression with risk group. Plots show medians as a line between boxes representing the first and third quartiles; the whiskers represent the range after excluding the outliers. The outliers are defined as data points that fall outside of the first and third quartiles by more than 1.5-times the interquartile range. Circles falling outside the whiskers represent outliers.

